Benthic macroinvertebrates as an indicator of watershed health
2020 Trends | Watershed Health
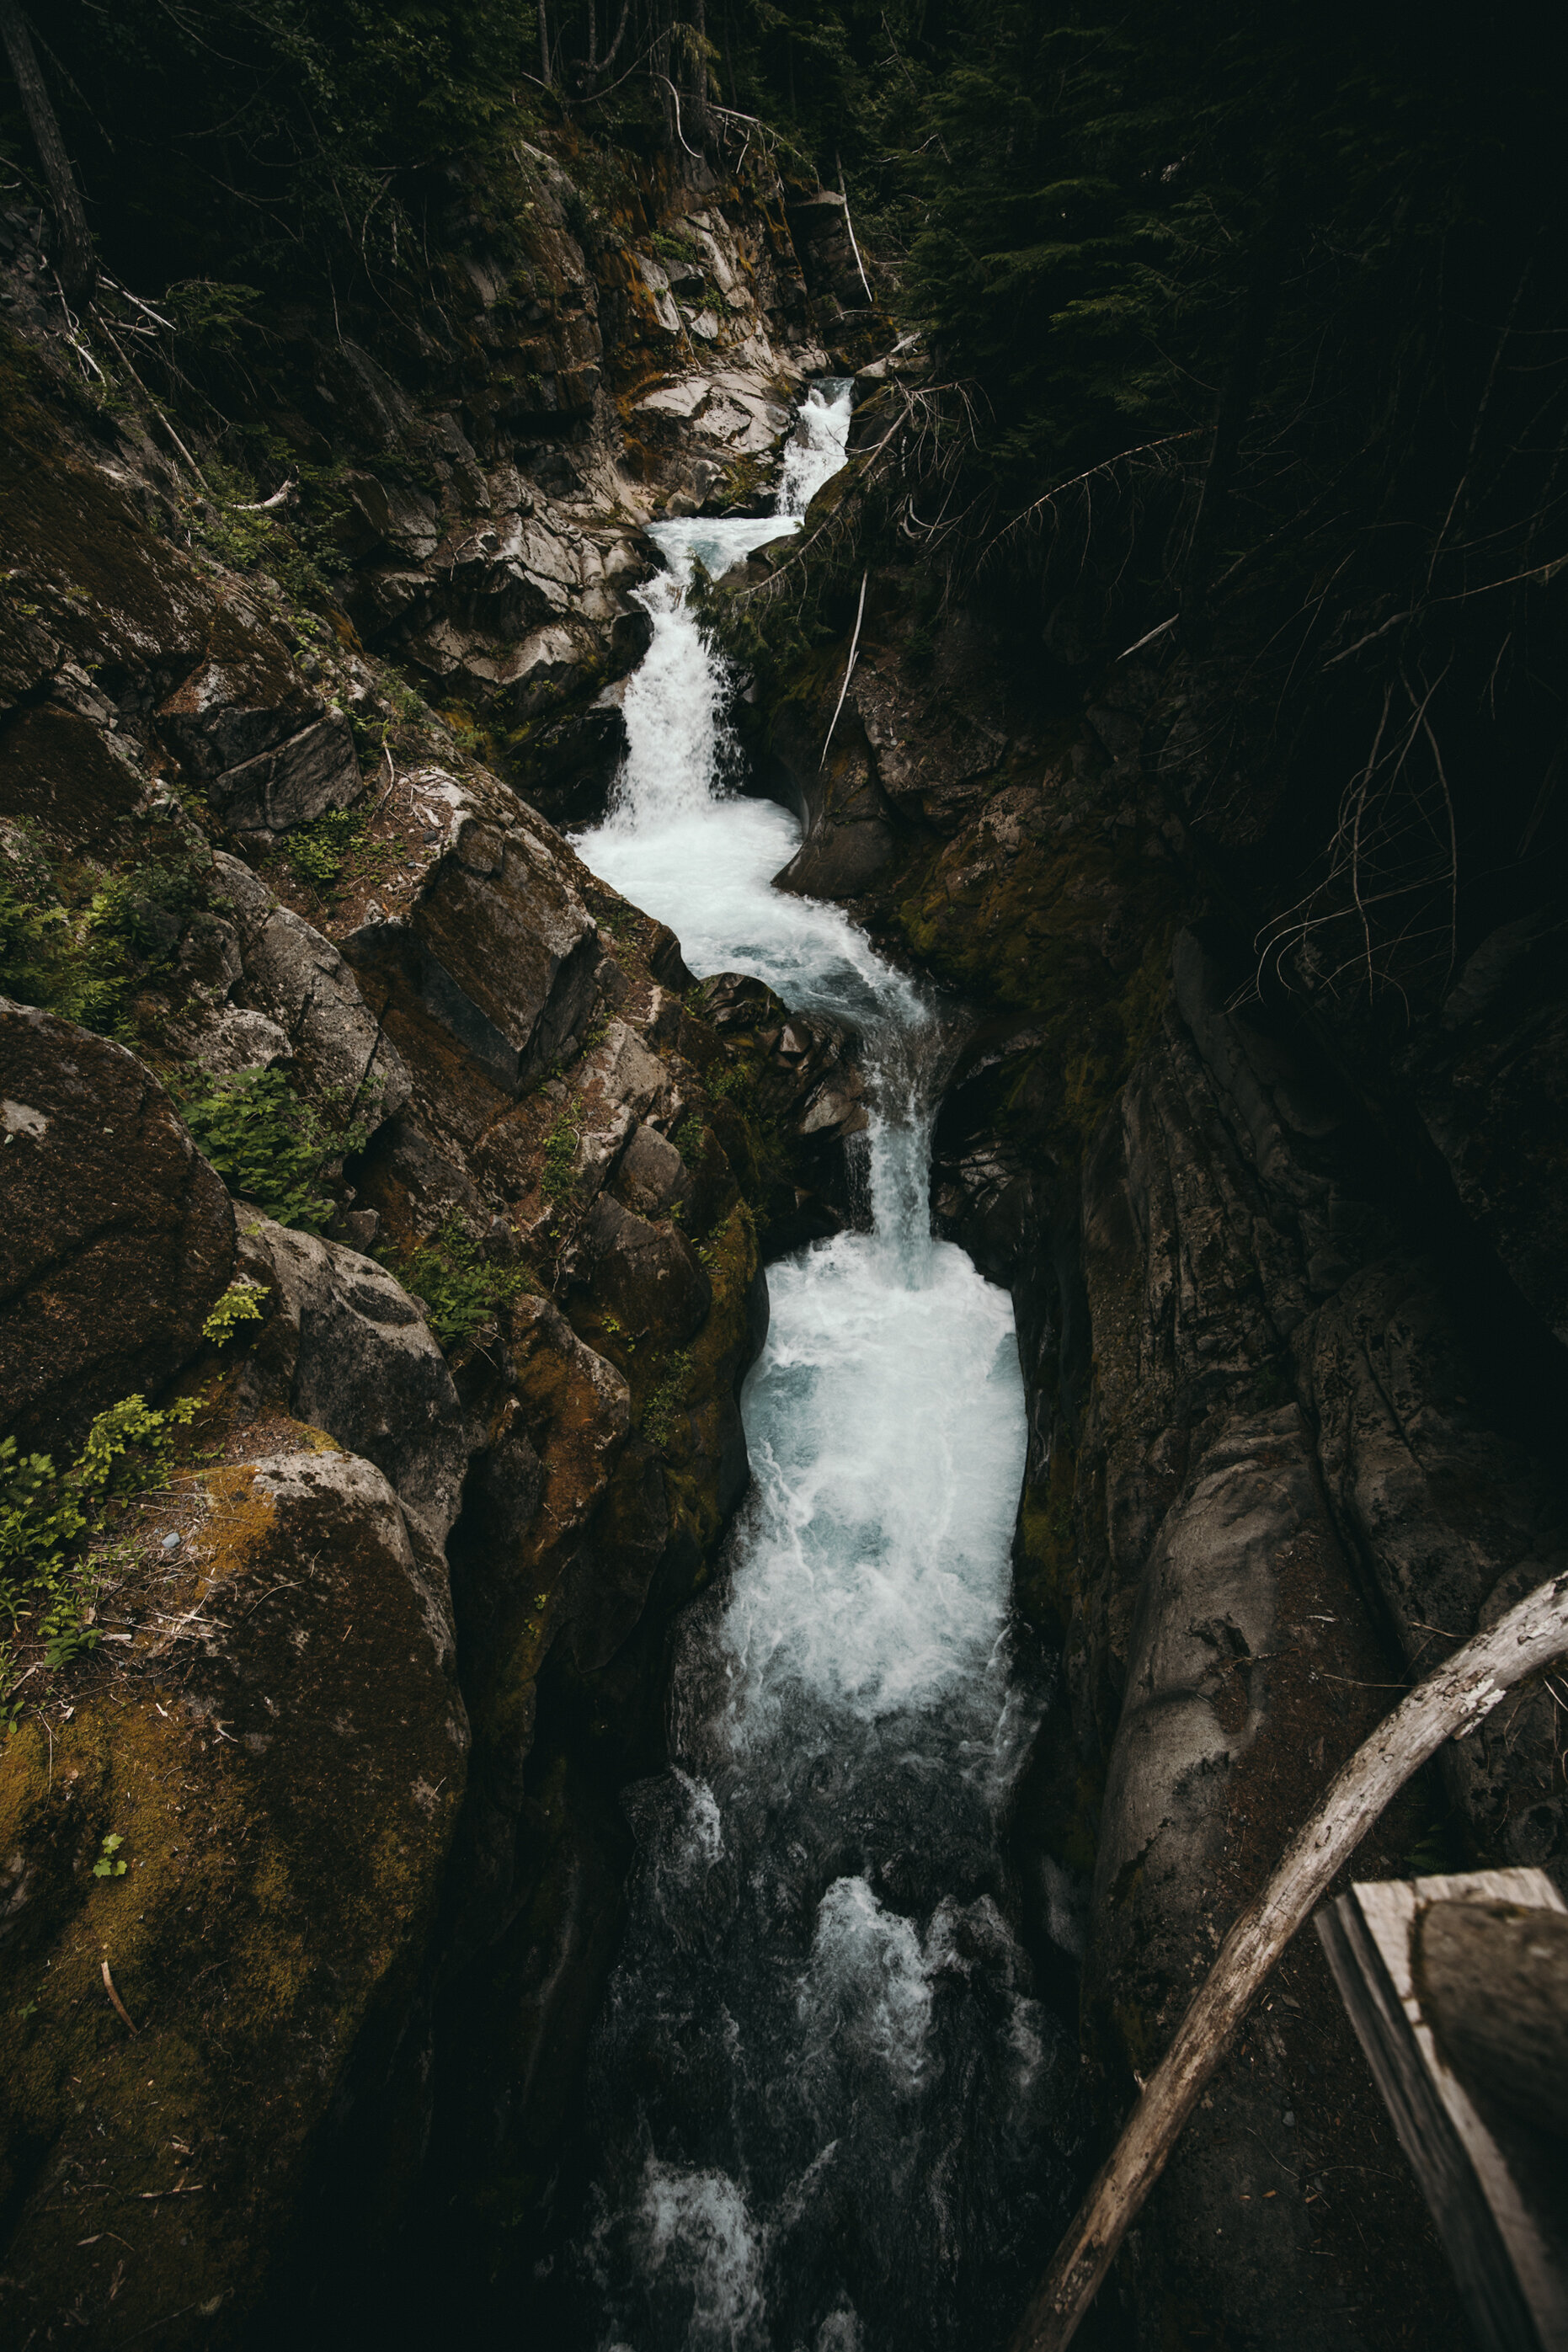
Watersheds are a network of creeks, streams, rivers and lakes, and they are part of a nested system of watersheds. Watersheds can be small, like Left Hand Creek and Boulder Creek watersheds, or they can be large like the St. Vrain Creek watershed that contains them both. Watersheds contain far more than water bodies. They include the land that drains into the water bodies from rain, floods, or snow melt. Here we present data on two watersheds, Left Hand Creek and Boulder Creek watersheds, as an indication of Boulder County’s watershed health.
While watershed health can be studied in many ways (such as looking at conditions of forests, cities, or grasslands), studying water in a creek is a great indicator of conditions in the creek and the surrounding land. In the creek, the Benthic Macroinvertebrate (BMI) community is a key indicator of water quality and can indicate the state of the watershed in general.
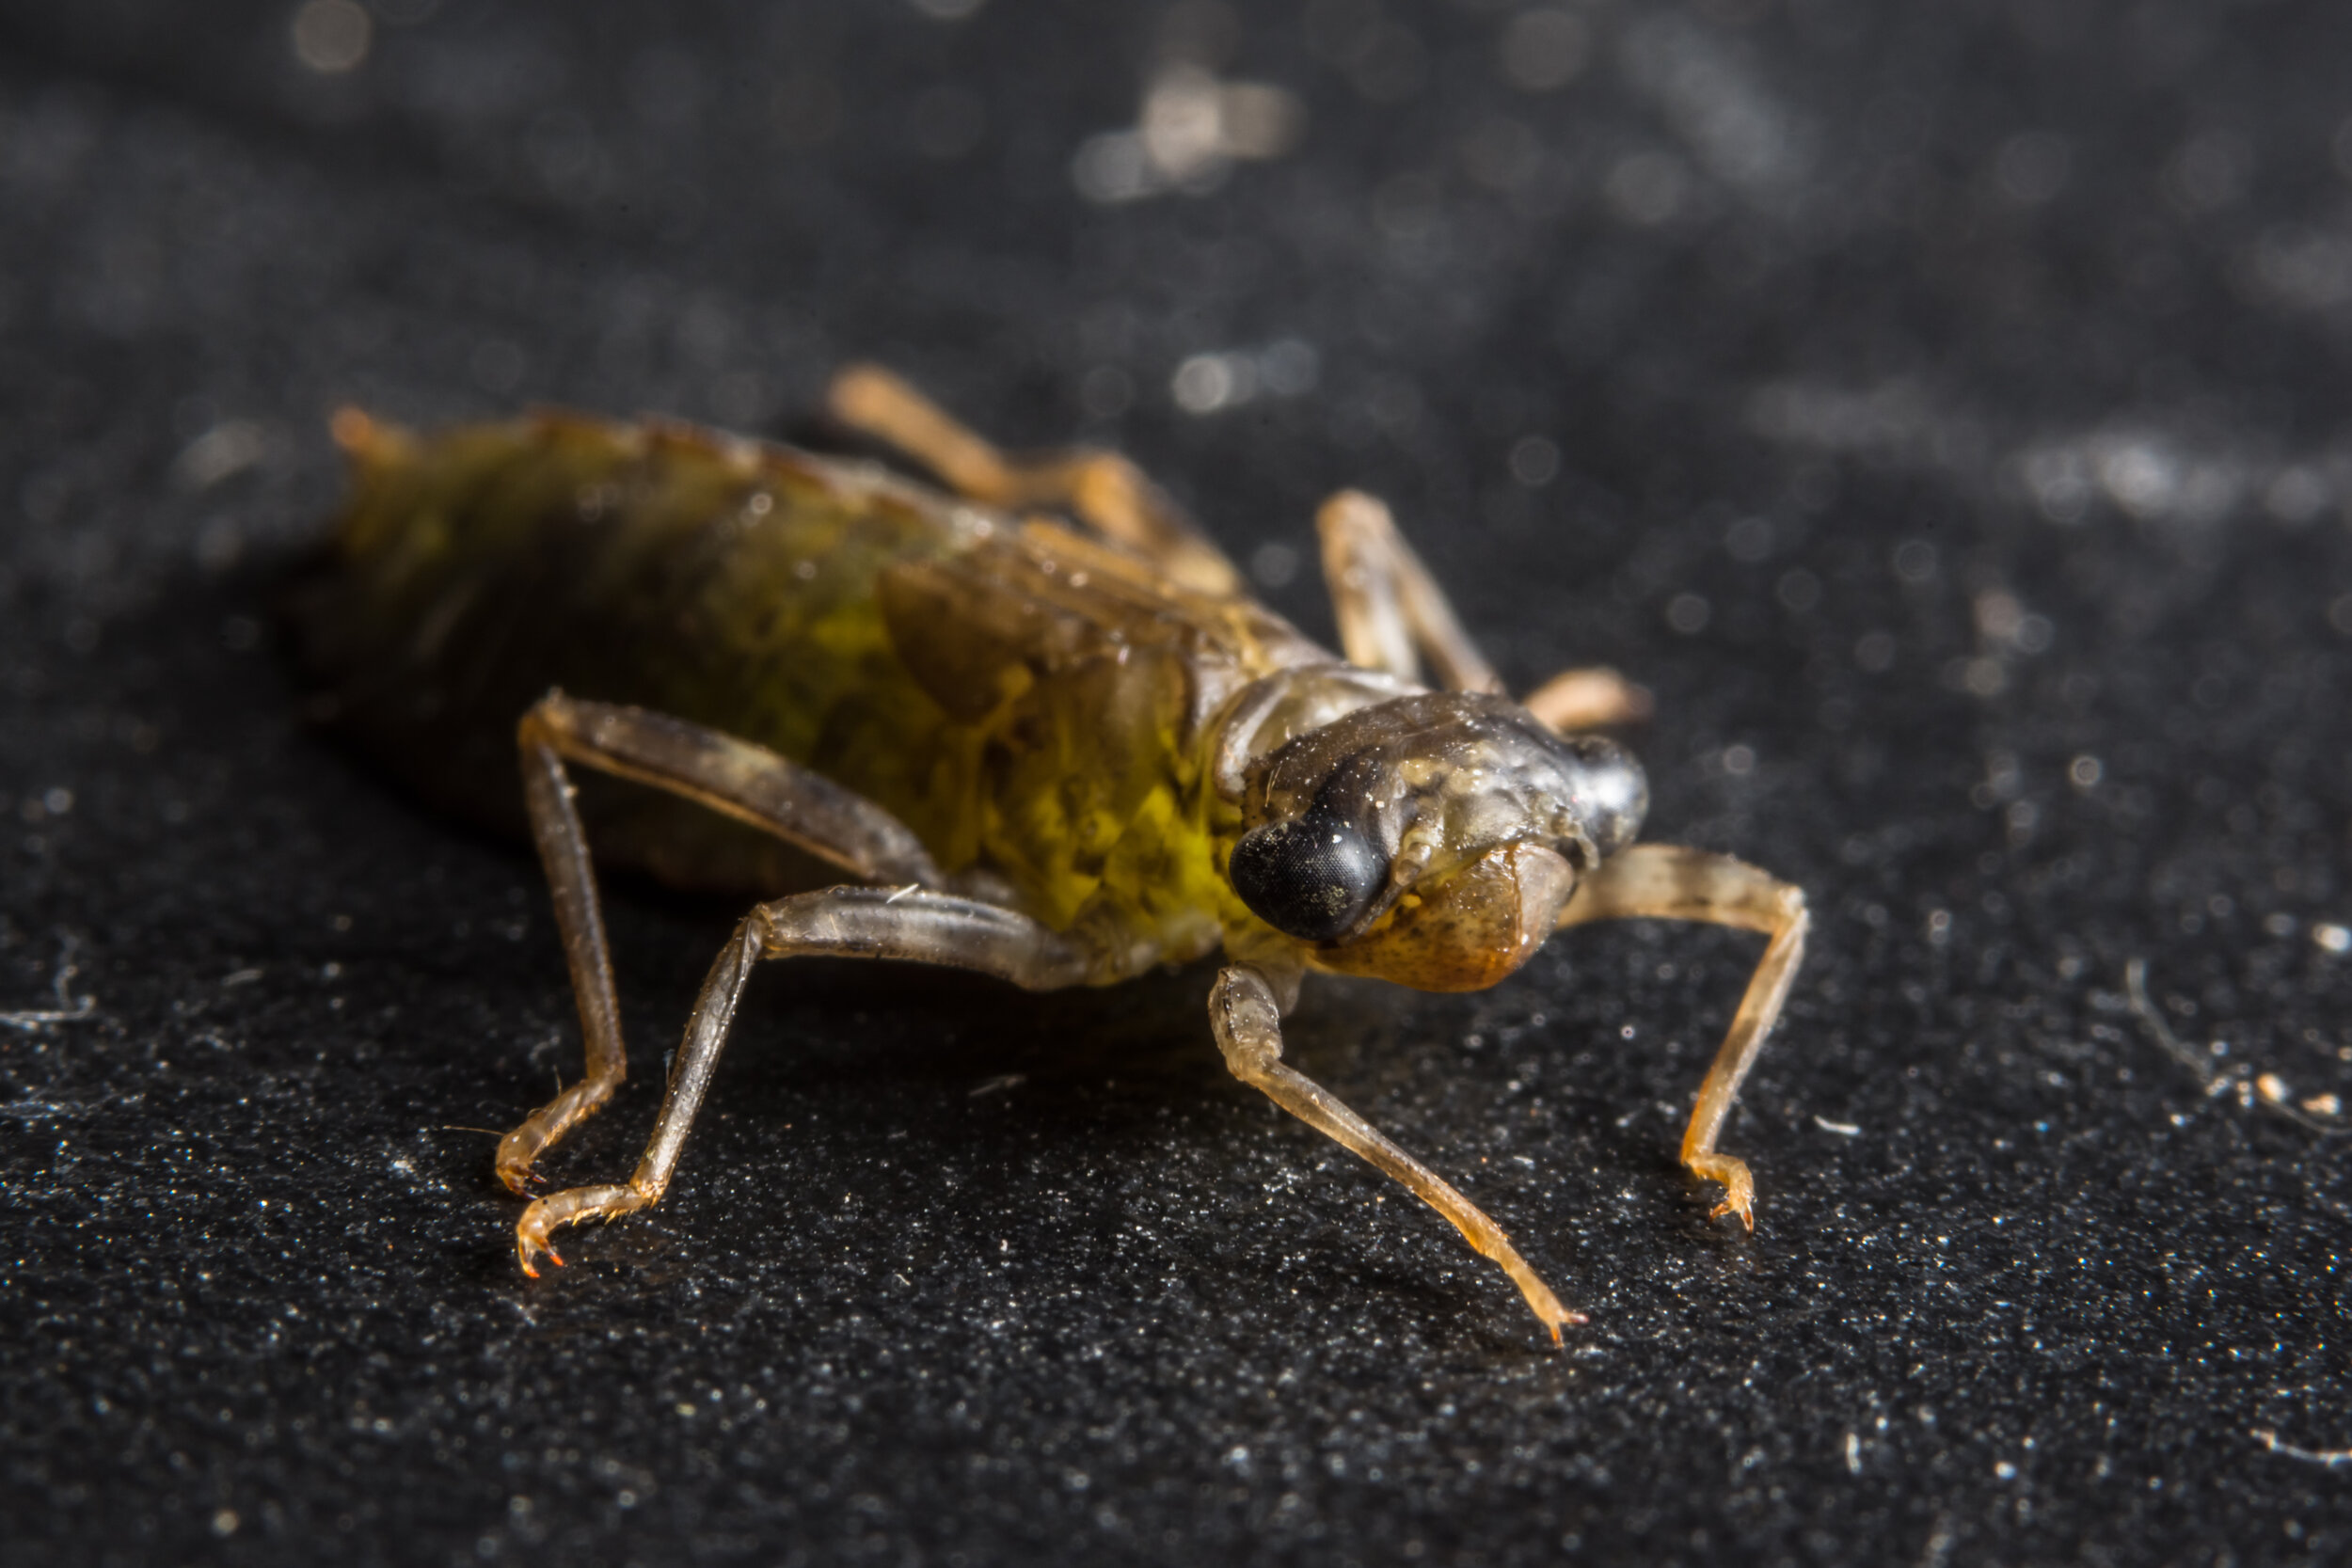
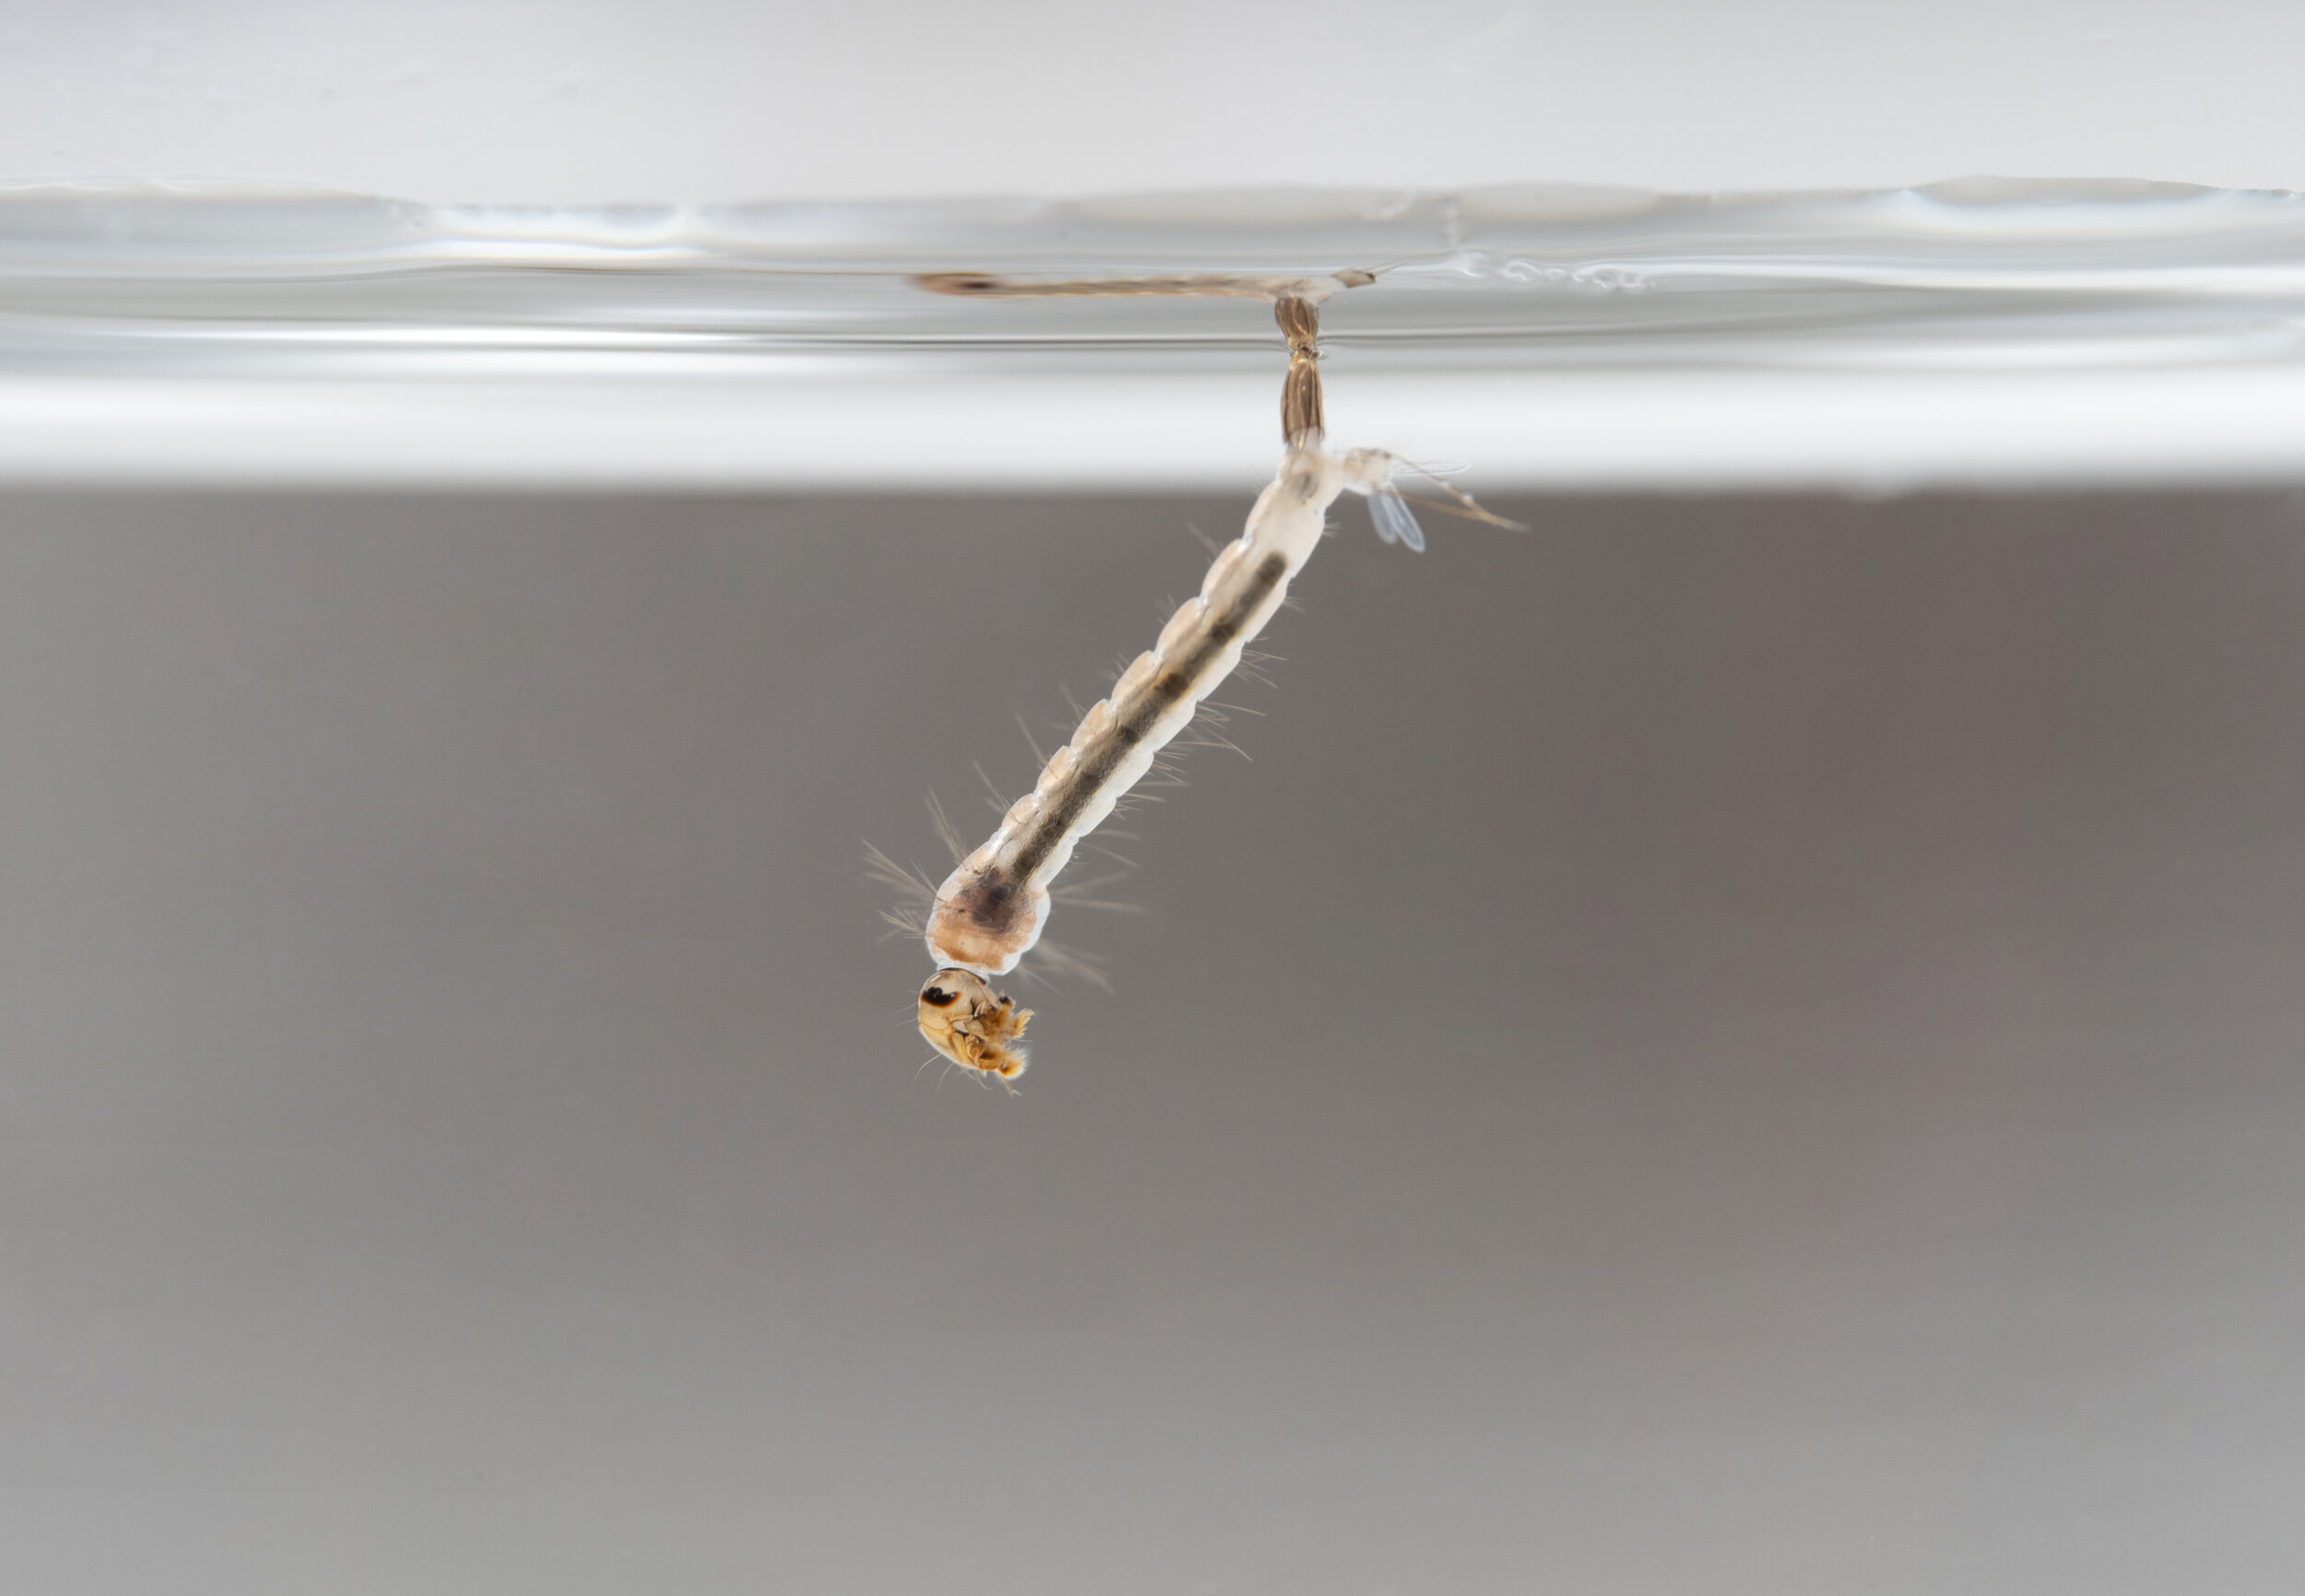
BMI are insects that naturally reside in our creeks and streams - the term ‘macro’ is used because we can see the invertebrates without a microscope. BMI come in the form of worms, snails, beetles and larvae, e.g. dragonflies. They are prey for both animals in the water, like fish, as well as animals that live by the water, like birds. They are also predators of other invertebrates. Additionally, they break down and recycle organic matter, such as plant parts (leaves and sticks).
BMI are one of many variables used to describe water quality because many macroinvertebrate species are sensitive to pollutants. Therefore, the presence or absence of these particular taxa can indicate the state of their ecosystem. From a BMI sample, scientists and land managers calculate a Multi-Metric Index (MMI) as an indicator of water quality and watershed conditions. The MMI score, presented in Figures 1 and 2 and described in more detail below, integrates multiple BMI community metrics. This score can identify disturbance in a water source that simultaneously can describe the state of our watershed.
While we only focus on MMI in this report, there are many different ways to use the BMI community to evaluate the health of water bodies and their watersheds.
explore the data
Mapping MMI scores across Boulder Creek and Left Hand Creek watersheds, as an indication of watershed health.
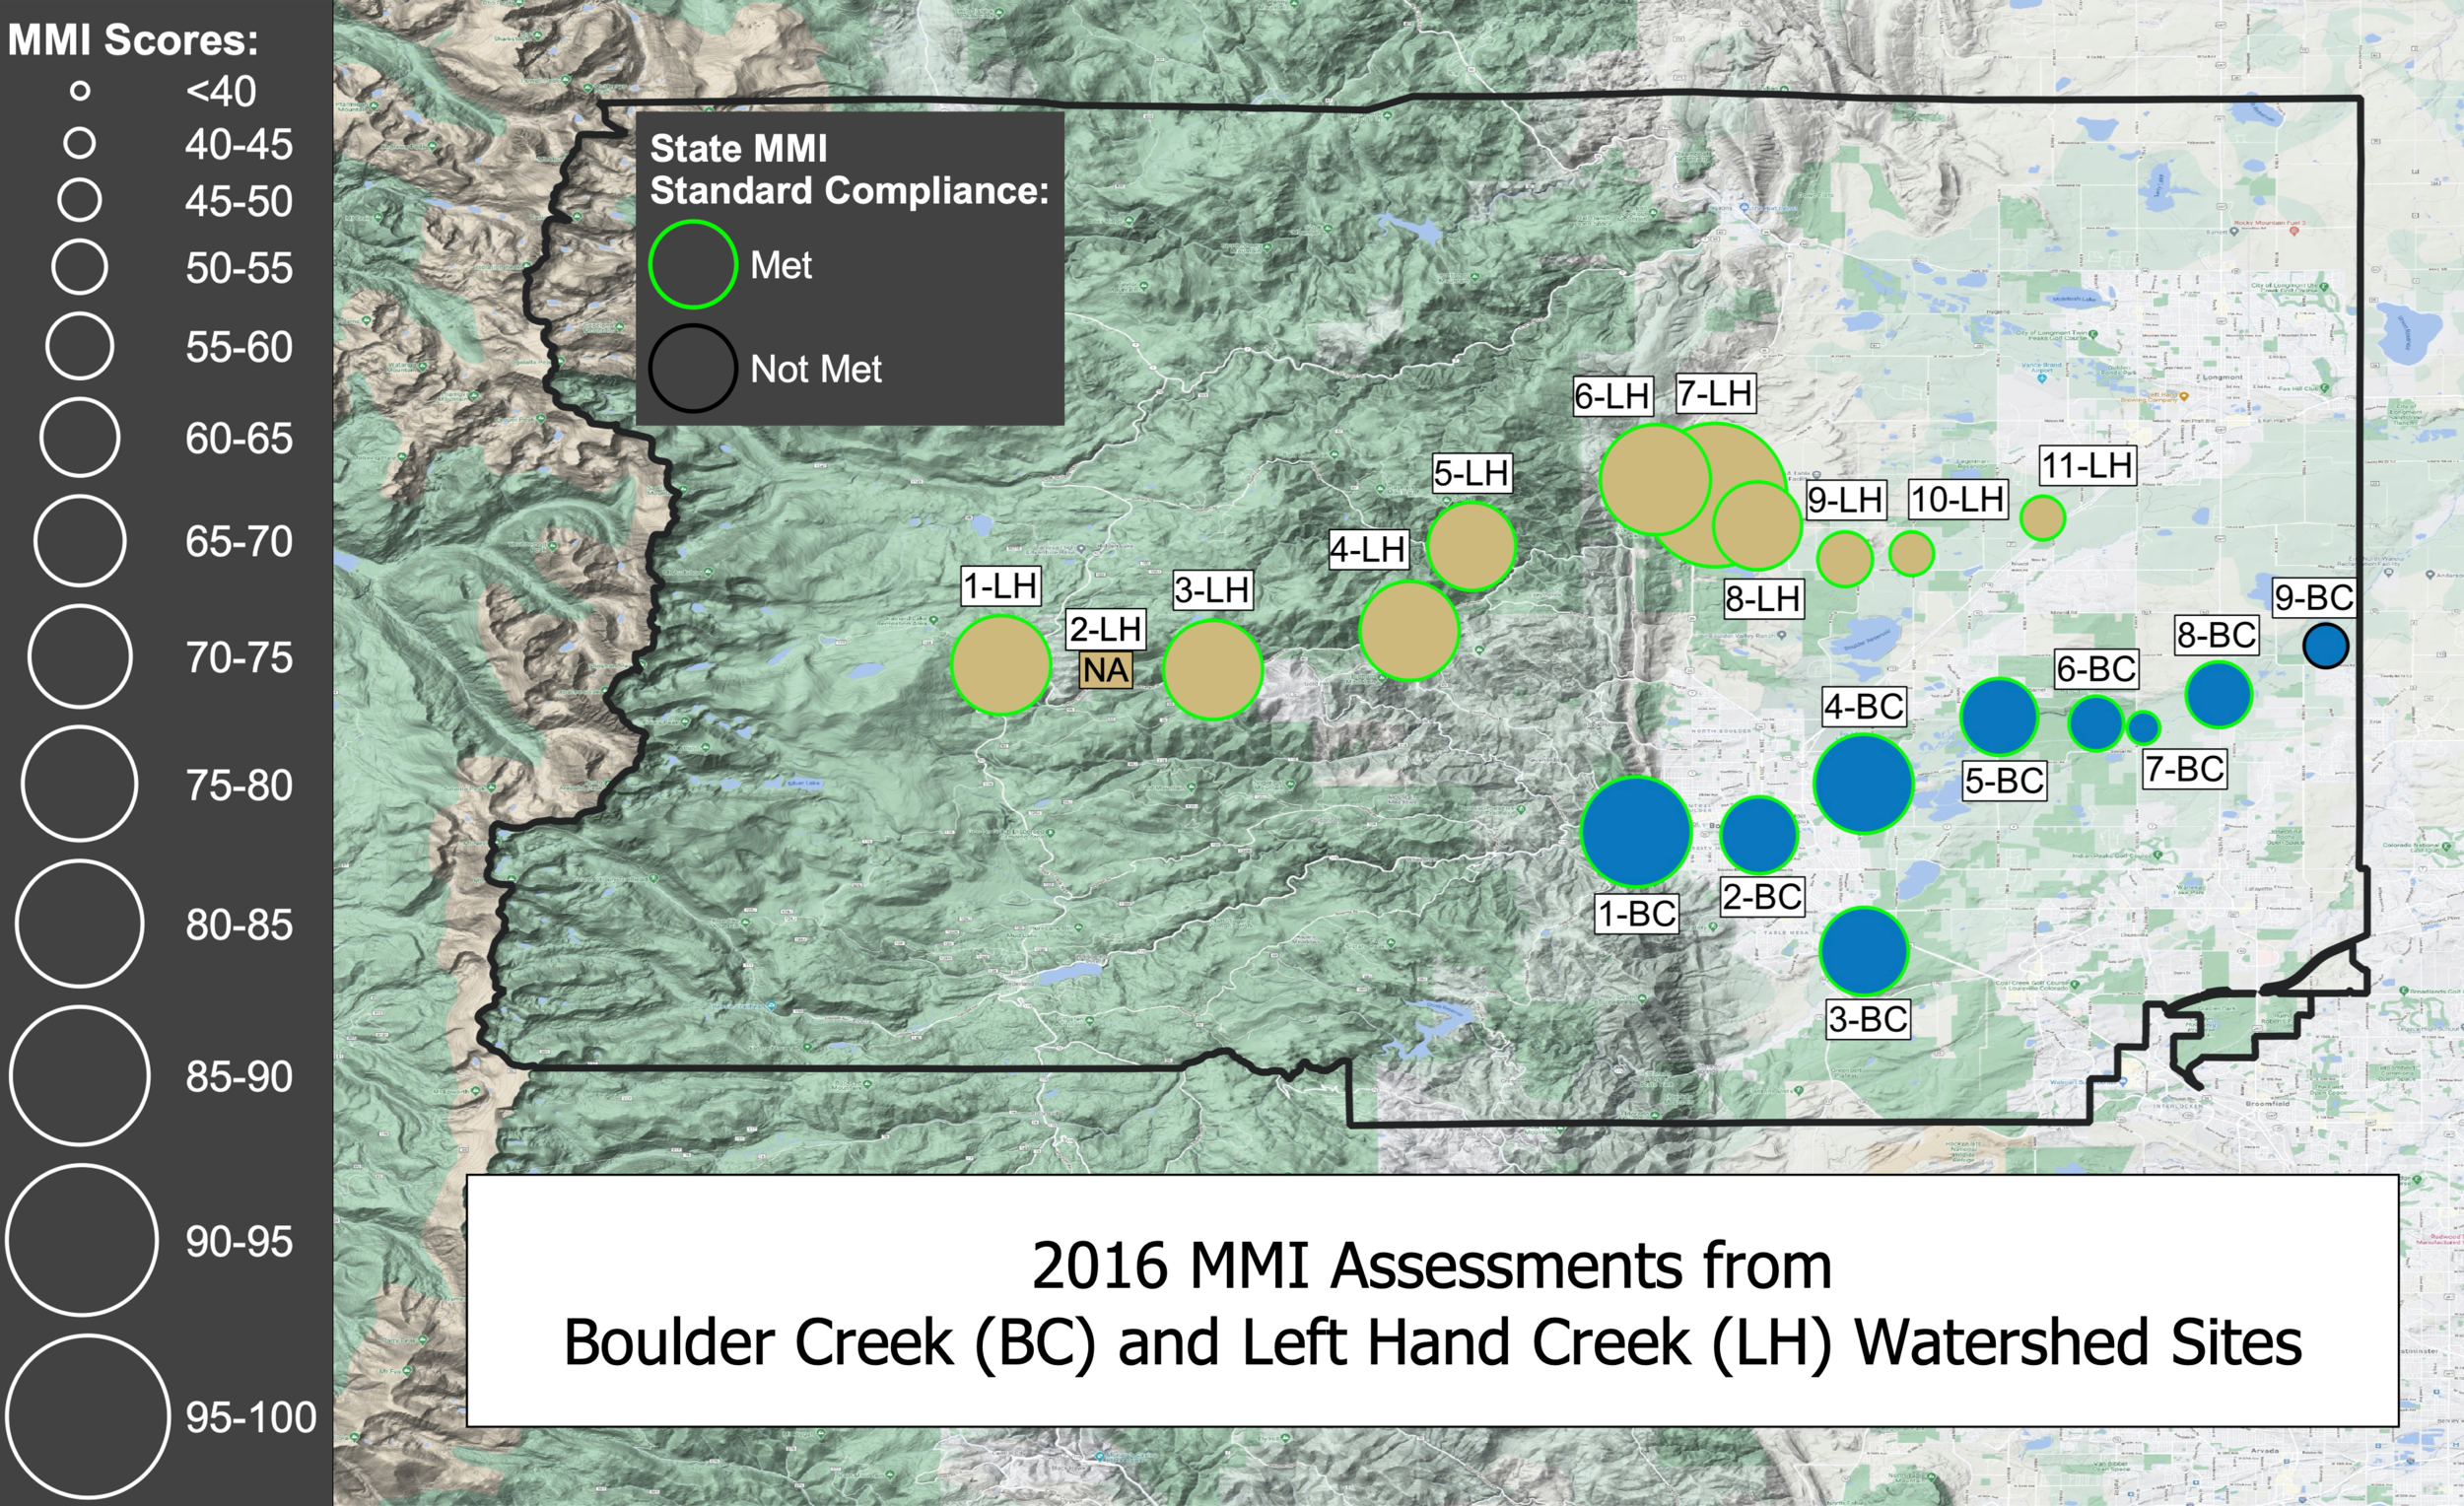
Figure 1. MMI Map 2016. MMI scores (Multi-Metric Index) measure the level of biological disturbance based on the composition of BMI (benthic macroinvertebrate) communities. These visible water insects in both Boulder Creek (BC) and Left Hand Creek (LH) are indicators of watershed health because they have predictable responses to disturbance. MMI scores give state regulators a quantitative method to assess water bodies based on these predictive responses. Acceptable MMI scores vary by location, but overall, the higher the MMI score (the larger the circle), the better the BMI community, an indicator of watershed health. In 2016, state acceptable MMI scores for Left Hand Creek sites were 50 in the foothills/high plains (6-LH to 11-LH), and 52 in the canyon (1-LH to 5-LH). All but one site met expectation. The 2-LH site is represented by ’NA’ because there were too few BMI in the sample to calculate an MMI score. The low count of BMI at this site is likely due to poor water quality caused by acidic mine drainage from the Captain Jack Mine just upstream from the 2-LH site. Boulder Creek also met state standards at most of their foothills/high plains sites (1-BC to 9-BC), with MMI scores above 52. The two monitoring locations that did not meet the state criteria (7-BC and 9-BC) were further examined using the state’s method. Site 7-BC was later found to meet the state’s MMI standard (the green border), but 9-BC did not with an MMI score of 50.2 (represented by a black border). However, if 9-BC’s MMI score was calculated using prairie as its location type, arguably more appropriate, then it too would meet the state’s MMI score standard. Source: Left Hand Watershed Center and the City of Boulder.

Figure 2. MMI Map 2018. MMI score standards were updated in 2018. The updated scoring process shifted Boulder Creek’s acceptable MMI score to 45.2 at all sites, while Left Hand Creek’s acceptable scores remained the same at 52 in the canyon and 50 in the foothills/high plains. Colors and abbreviations in this figure remain the same as in Figure 1 (LH gold and BC blue). Boulder Creek met state standards at 100% of their sites in 2018. In 2018, 73% of Left Hand Creek sites met state standards, and included the site 2-LH. There are two likely sources of perturbation in Left Hand Creek. In the canyon, just above site 2-LH, Captain Jack Mine continued to impair water quality. Moreover, the mine had a release prior to this sample that created acidic conditions with metal deposits causing fish kills and a decrease of sensitive BMI for miles downstream. Events like this can cause low MMI scores as it did at 2-LH (MMI 46.5). Downstream in the foothills/plains, 8-LH and 9-LH BMI samples may have been impacted by dry periods or low to no flow conditions. Low stream flow or available water reduces BMI habitat quality and is likely more concentrated with nutrients or other pollutants that may lower MMI scores from 2016 to below state standards (8-LH and 9-LH with MMI scores of 29.7 and 40.8, respectively). All three sites that did not meet the state standard are represented with a black border. Source: Left Hand Watershed Center and the City of Boulder.
possible reasons for low MMI scores
The influential factors of BMIs’ community status are both natural (e.g. floods or wildfire) and anthropogenic (e.g. urbanization or agriculture).
Disturbances can impact water quality at the local scale and have a much wider impact on the watershed. For example, mines can release toxic substances into waterways that can disrupt BMI habitats, reflected in low MMI scores. In other locations, it is possible that low stream flow, either natural or from water diversion (e.g. for drinking water or agricultural needs), can cause stress in BMI ecosystems. Other potential disturbances include nutrient deposition from agriculture (anthropogenic) and post-fire runoff (natural). Disturbances can also vary in scale, impacting BMI locally or for long distances. For example, the fires of October 2020 may be visible in future MMI scores for Boulder County watersheds.
recommendations
Support organizational and public action for watershed health.
Left Hand Watershed Center will continue to monitor and assess watershed health and use data collected to inform future management recommendations and actions. This includes a new effort to work with stakeholders throughout the St. Vrain Basin, including the city of Boulder, to develop a shared basin-scale adaptive management framework.
Incorporating forests into adaptive management is also a critical next step, particularly given the recent local fires. In all of their work, the Watershed Center engages the community in science, stewardship, and place-based participatory learning.
The city of Boulder conducts routine water quality and biological monitoring along Boulder Creek, implements stream restoration projects, and engages in collaborative education and outreach programs. These initiatives aim to minimize the city’s impact on water quality and improve both surface water conditions and watershed health for the greater Boulder Creek watershed. To find out how you can help protect your watershed, visit Keep it Clean Partnership.
To learn more about the Watershed Center’s community science, stewardship and education programs, visit the Left Hand Watershed Center website.