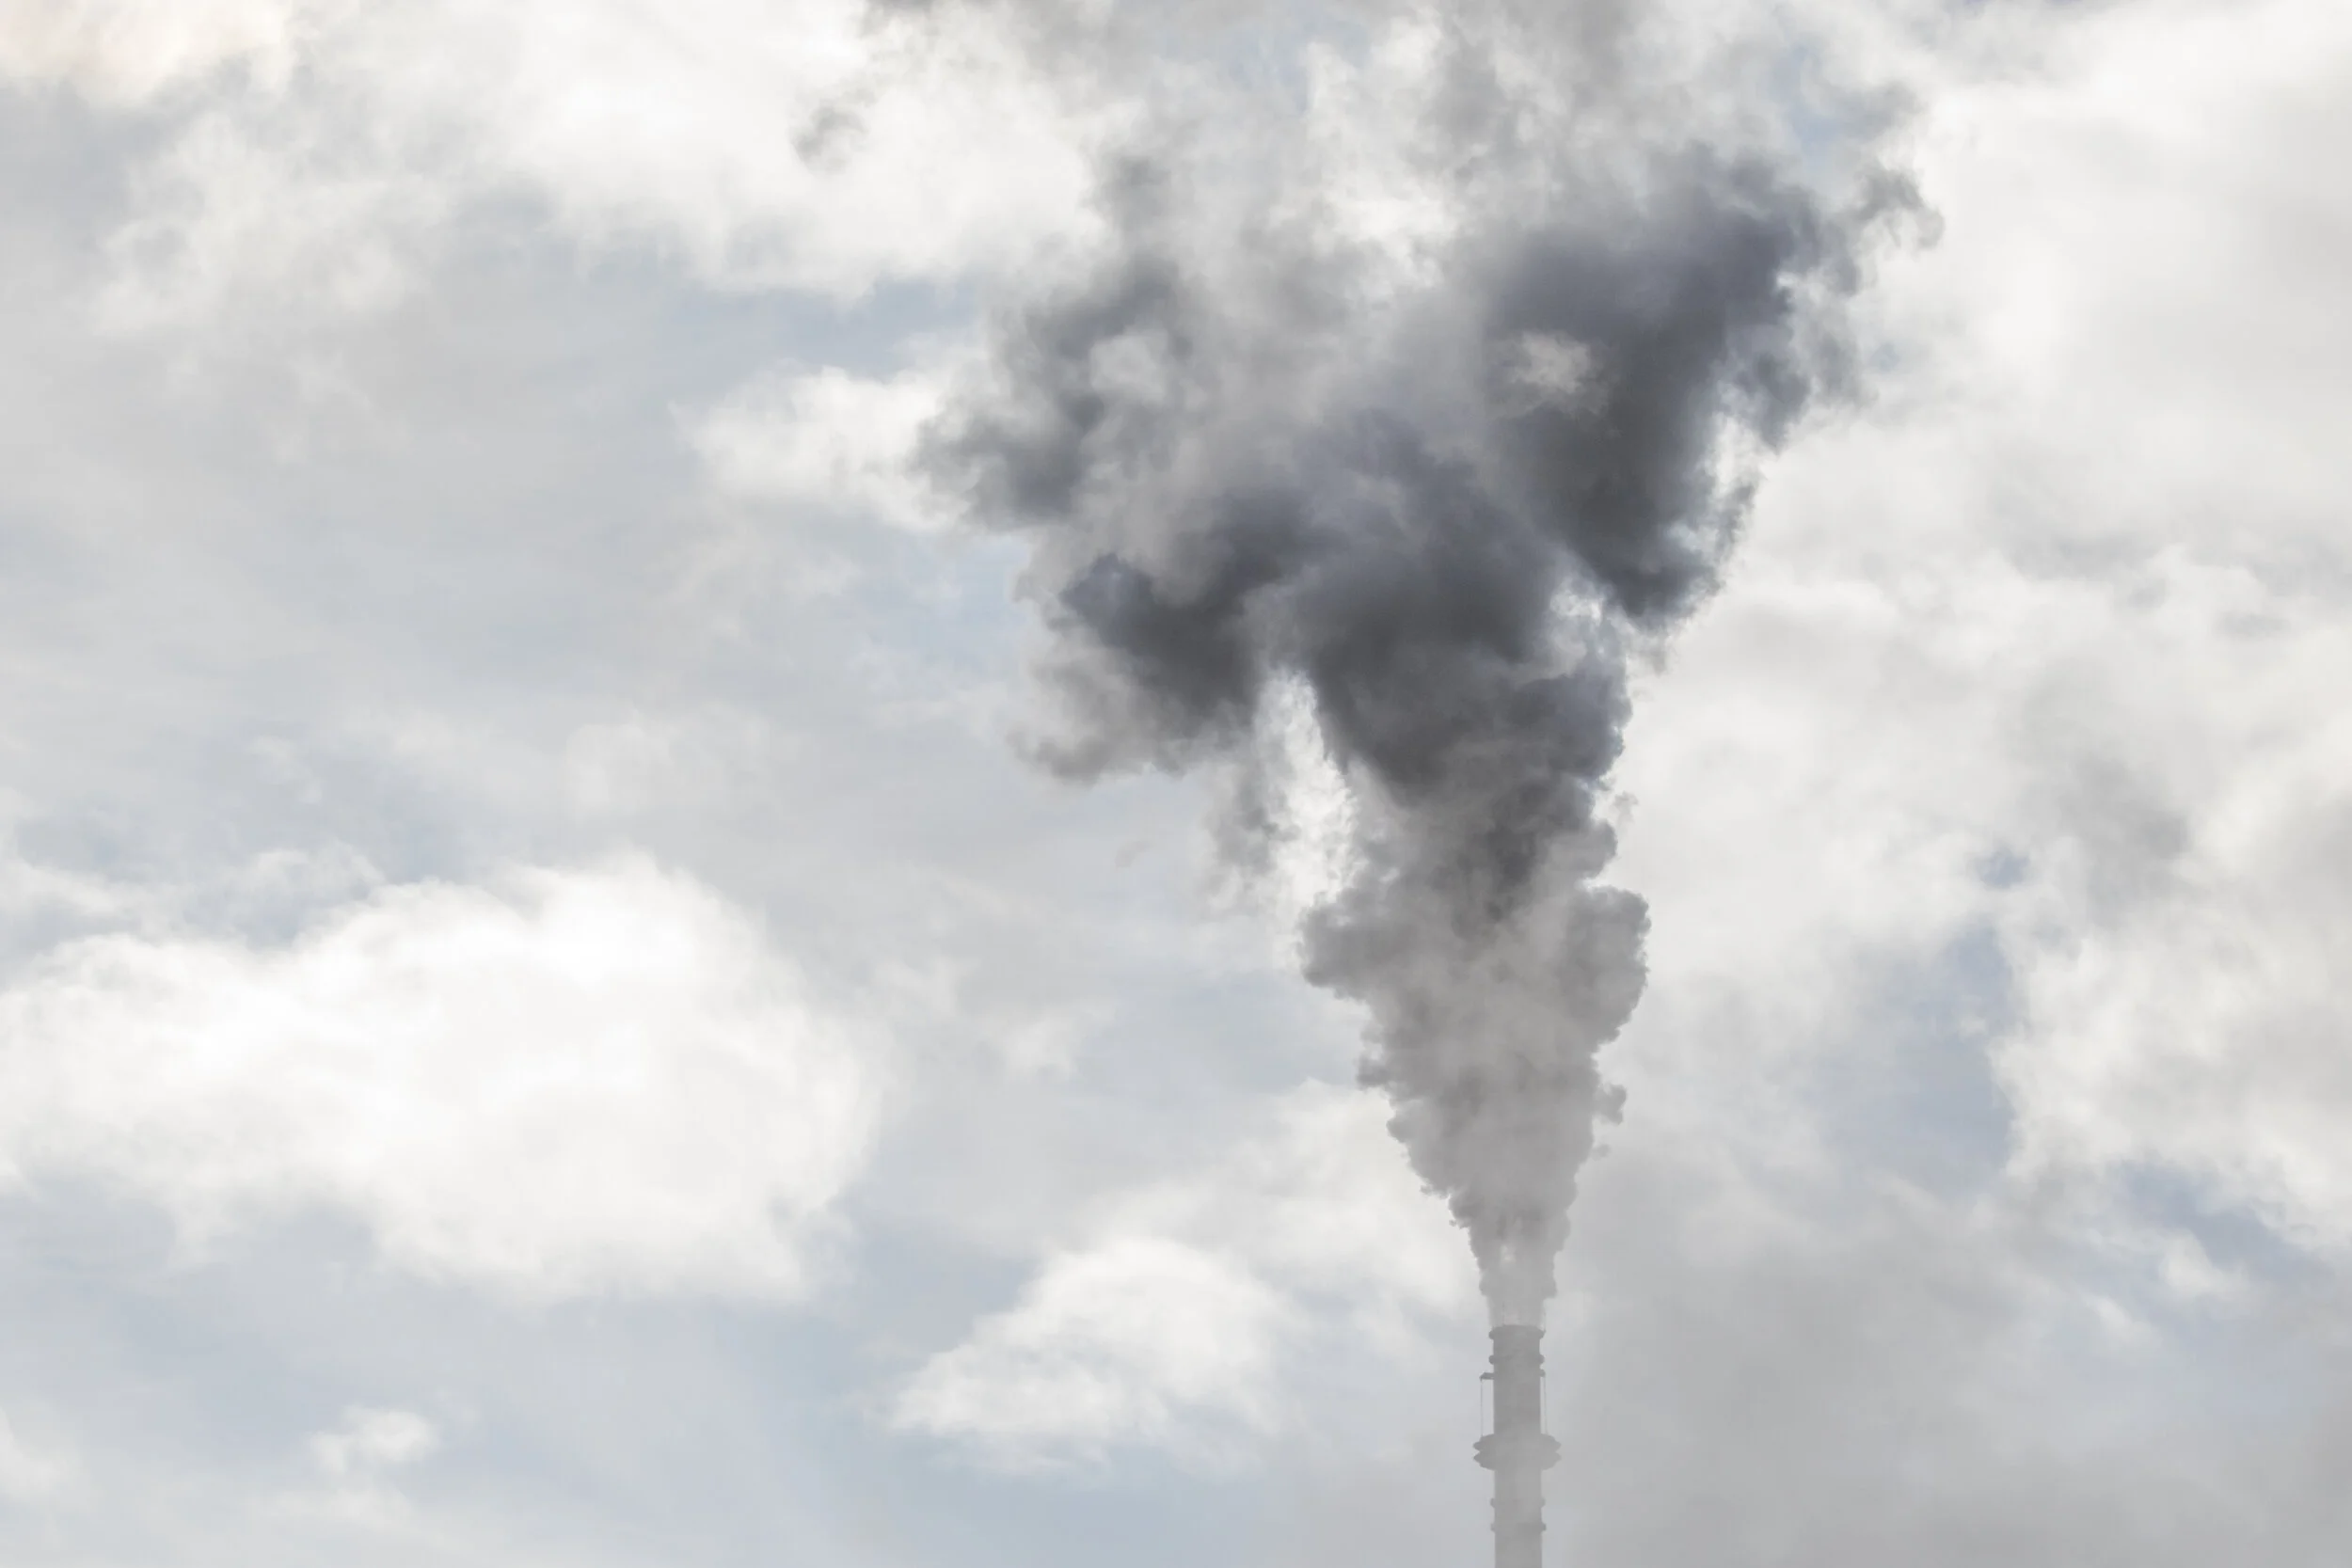
Boulder’s ozone concentrations frequently rise above air quality standards
Numerous factors contribute to the rise of harmful ozone levels in Boulder. Ozone is not directly emitted from human-made sources, but forms in our atmosphere under certain conditions. Colorado is struggling to meet air quality standards, despite regulations in place on oil and gas emissions throughout the state.
Ozone formation happens differently depending on where in the atmosphere it is found. When it is formed high in the stratosphere, it acts as a protective barrier that shields the Earth’s surface from harmful ultraviolet radiation. Weakening layers of ozone in the upper atmosphere raise concerns for public health experts. With more radiation exposure, there is a potential for the rise in skin-related cancers and eye damage from increased levels of UV light. However, when we talk about regulating ozone concentrations, we are mainly concerned about tropospheric level ozone.
When ozone concentrations build up in the troposphere (the atmospheric layer that sits just above the Earth’s surface and reaches a height of approximately 10 km), they have negative impacts on health, particularly for respiratory processes, leading to cellular damage in plants and animals.
How is ‘ground-level ozone’ formed?
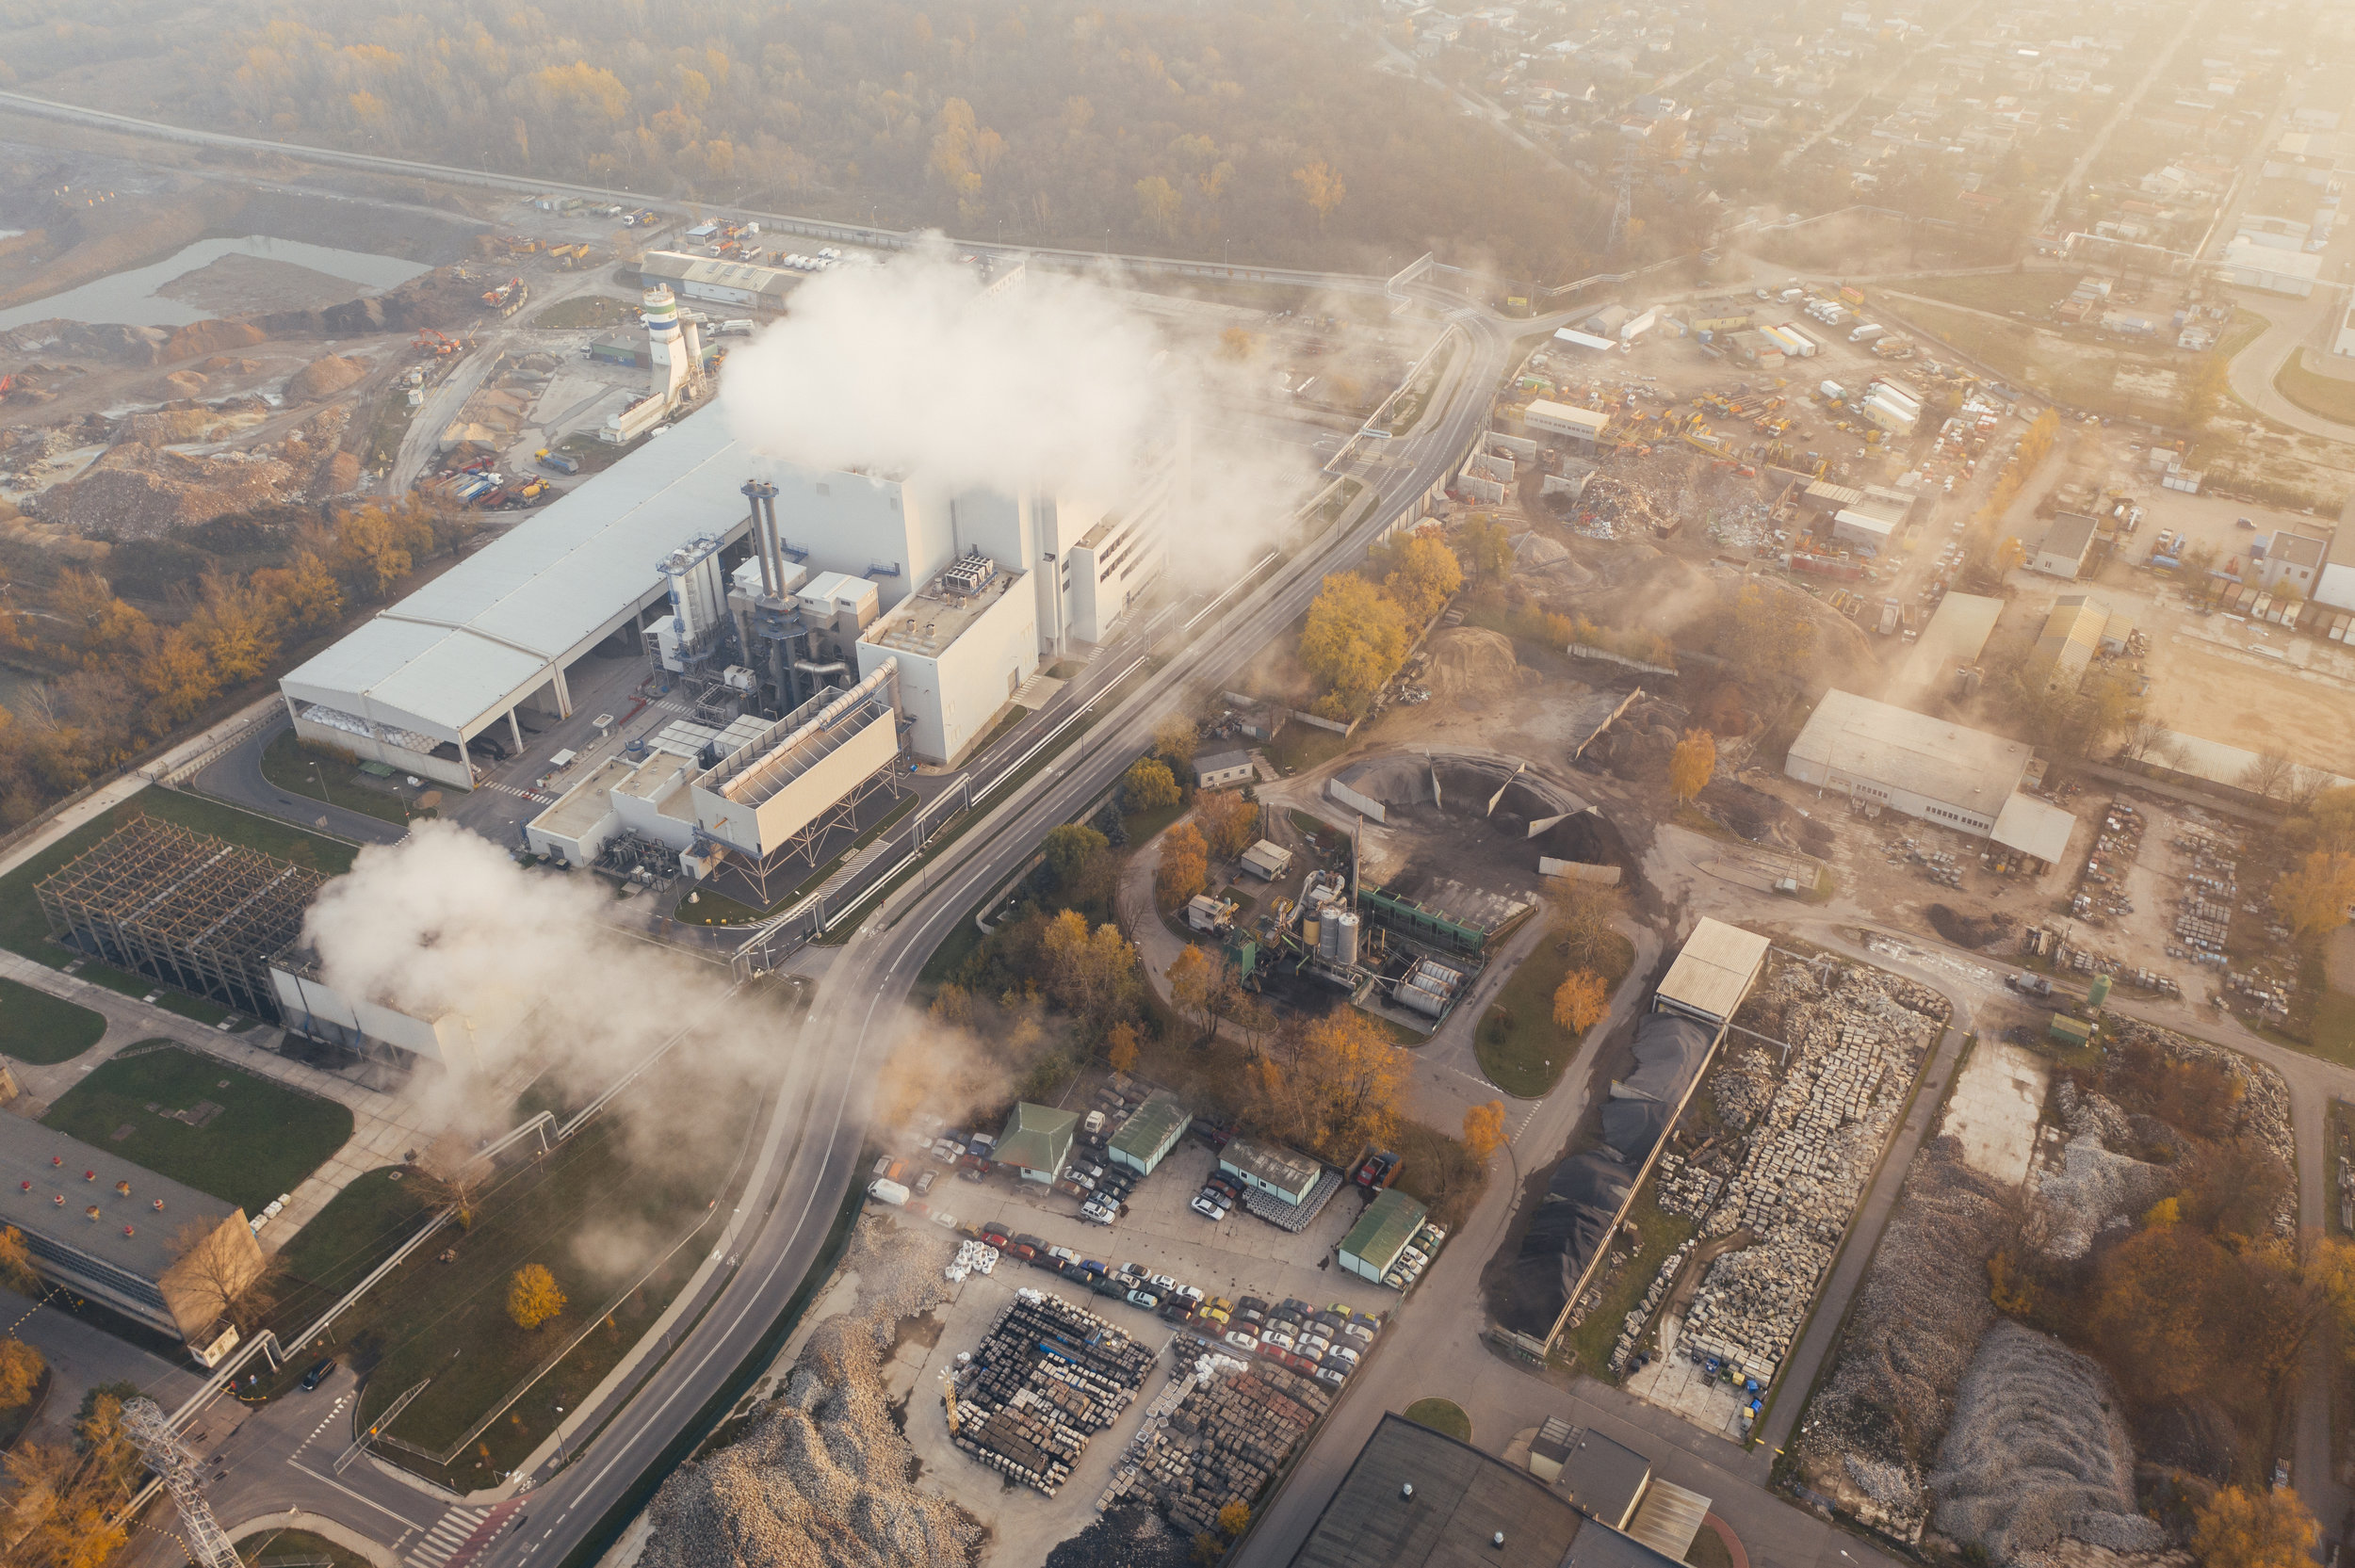
According to the EPA, ozone is formed through “chemical reactions between oxides of nitrogen (NOx) and volatile organic compounds (VOCs).” Ozone occurs from a combination of VOCs from oil and gas emissions and NOx from urban and industrial emissions. Both sectors contribute to total ozone production on high ozone days, although industrial emissions contribute somewhat less to ozone on average.
Ozone levels in Colorado
The generation of emissions from local oil and gas industries has more than doubled since 2000, with the City of Denver exceeding the National Ambient Air Quality standard for over a decade. Because of Boulder’s geographic location and proximity to the Denver metro area, the conditions are right for locally generated pollution and poorer ambient air quality to stagnate over the city.
Ozone is a secondary pollutant source, which means it requires specific conditions in the atmosphere to form, and is found in its greatest concentrations in the early afternoon.
The EPA National Ambient Air Quality standard for ozone is set at 0.07 ppm (this is referenced as a black horizontal line in the figures below). VOCs from oil and gas emissions, together with urban and industrial emissions, contribute to around 60-80% of the total ozone production on high ozone days. Atmospheric data from the Boulder Reservoir does show that ozone levels peak each year in the summer months (Figure 1), with some of these levels exceeding the EPA’s air quality standards. How we regulate these emissions will largely determine our ability to curb ground-level ozone.
explore the data
Maximum daily ozone levels (ppm), measured at the Boulder Reservoir
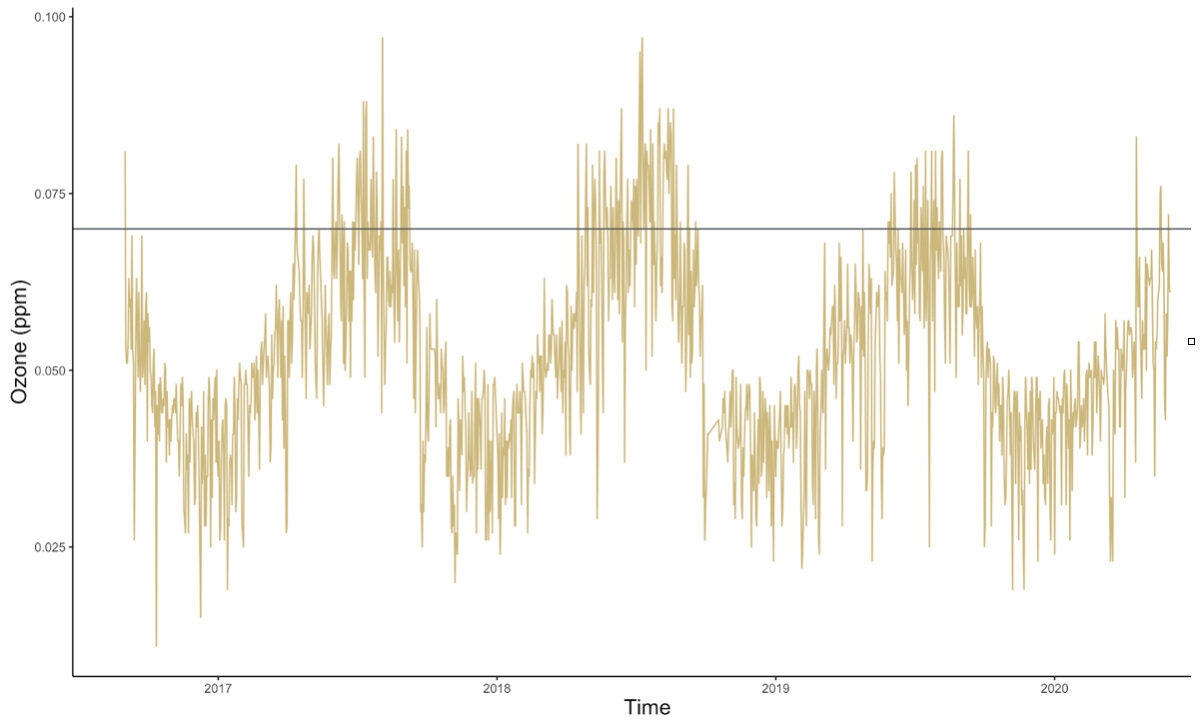
Figure 1: Ozone concentrations at the Boulder Reservoir, measured in parts per million (ppm). The gold lines represent maximum daily ozone concentrations, measured per hour for an eight hour time period each day. Ozone data is collected using a Teledyne UV absorption monitor. The horizontal black line represents the EPA national air quality standard of 0.07 ppm. Notice that there is strong seasonal variation in ground-level ozone concentrations. High ozone concentrations typically peak during the summer months. Source: Data collection on ozone by the Colorado Department of Public Health and the Environment (CDPHE) and displayed on the Boulder A.I.R. LLC web site.
Maximum ozone levels, according to day of the year

Figure 2. Maximum ozone levels (ppm) at Boulder Reservoir by day of the year. Blue lines represent ozone concentrations, the gray curve represents the smoothed conditional mean of the data, and the horizontal black line represents the EPA national ambient air quality standard of 0.07 ppm. Maximum levels above the threshold occur during the months of April through September. Notice that high ozone concentrations occur seasonally, during summer months. Ozone data is collected using a Teledyne UV absorption monitor. Source: Data collection on ozone by the Colorado Department of Public Health and the Environment (CDPHE) and displayed on the Boulder A.I.R. LLC web site.

Despite its reputation for clean mountain air, Boulder is struggling to meet air quality standards / Unsplash
How many days were you vulnerable?

Table 1. Number of days above the EPA ozone threshold and peak vulnerability at Boulder Reservoir for years 2017, 2018, and 2019. Notice that high ozone concentrations occur seasonally, during summer months. Source: Data collection on ozone by the Colorado Department of Public Health and the Environment (CDPHE) and displayed on the Boulder A.I.R. LLC web site.
recommendations
Continuing to monitor the main emissions that contribute to the formation of ozone
Ozone cannot be monitored as a direct emission product from any of the major manufacturing, urban, and energy production sectors, so it is harder to monitor outputs that contribute to its production in the atmosphere. High concentrations of ozone, especially those that exceed EPA standards, have implications for public health. With this in mind, our recommendation is that Boulder should continue to tackle sources of ozone pollution and focus on improving its standards for vehicle and public transit emissions, creating an action plan to deal with regional haze, and working with industries to reduce VOC and NOx waste byproducts.